You are viewing a past election.
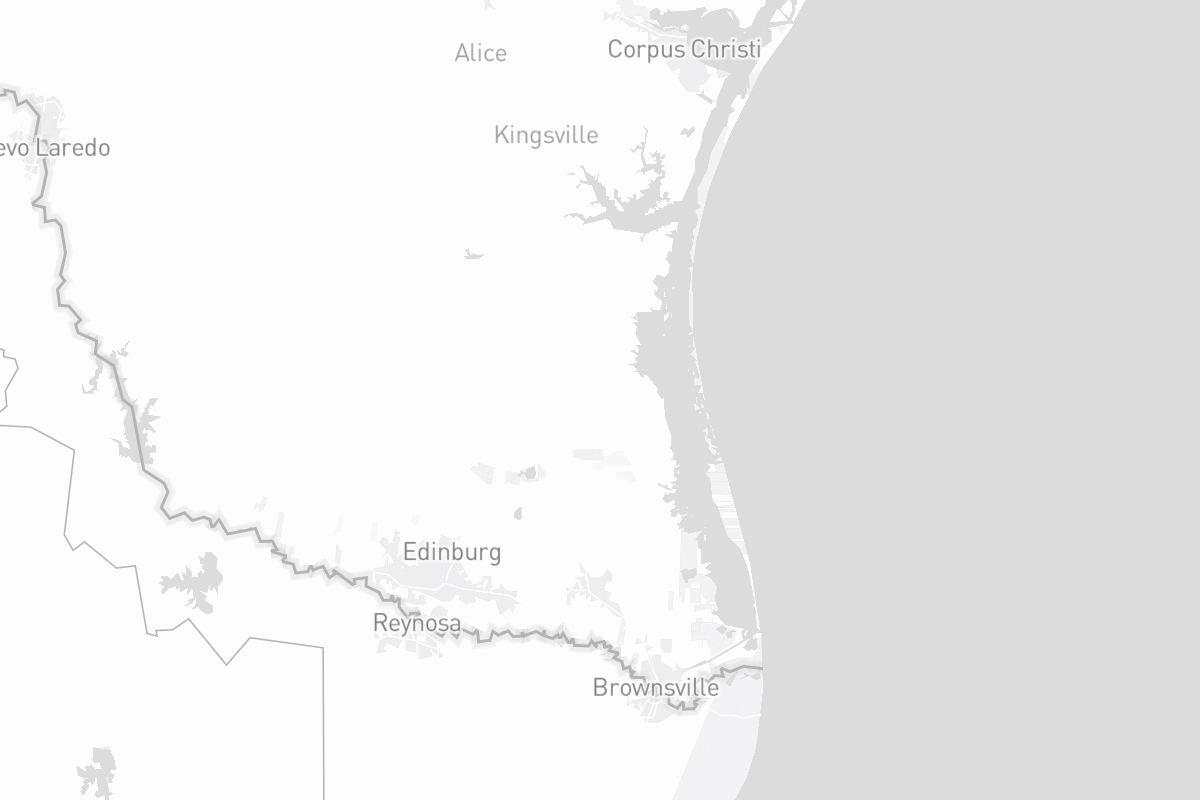
Texas
34th District
Lean D
D +1.3
D: 49.8%, R: 48.5%
2024 Election
Incumbent
Past Elections
TX-15: 2020
TX-34: 2022
Incumbent
Past Elections
TX-15: 2020
TX-34: 2022
Campaign Finance Data
| CANDIDATE |
RAISED |
SPENT |
CASH-ON-HAND |
Subscribe
To view past election results you'll need to have access to an active subscription.
No podcasts found for this election year.
Ratings
October 18, 2024
Lean Democrat
December 1, 2023
Likely Democrat
March 10, 2023
Likely Democrat
October 21, 2022
Tilt Democrat
August 25, 2022
Lean Democrat
June 15, 2022
Likely Democrat
December 3, 2021
Solid Democrat
November 15, 2021
Solid Democrat
December 6, 2019
Solid Democrat
February 15, 2019
Solid Democrat
December 1, 2017
Solid Democrat
February 27, 2017
Solid Democrat
December 4, 2015
Solid Democrat
April 3, 2015
Solid Democrat
December 17, 2013
Solid Democrat
March 8, 2013
Solid Democrat
August 10, 2012
Solid Democrat
April 6, 2012
Solid Democrat
March 23, 2012
Likely Democrat
February 29, 2012
Likely Republican
January 13, 2012
Solid Republican