Texas
32nd District
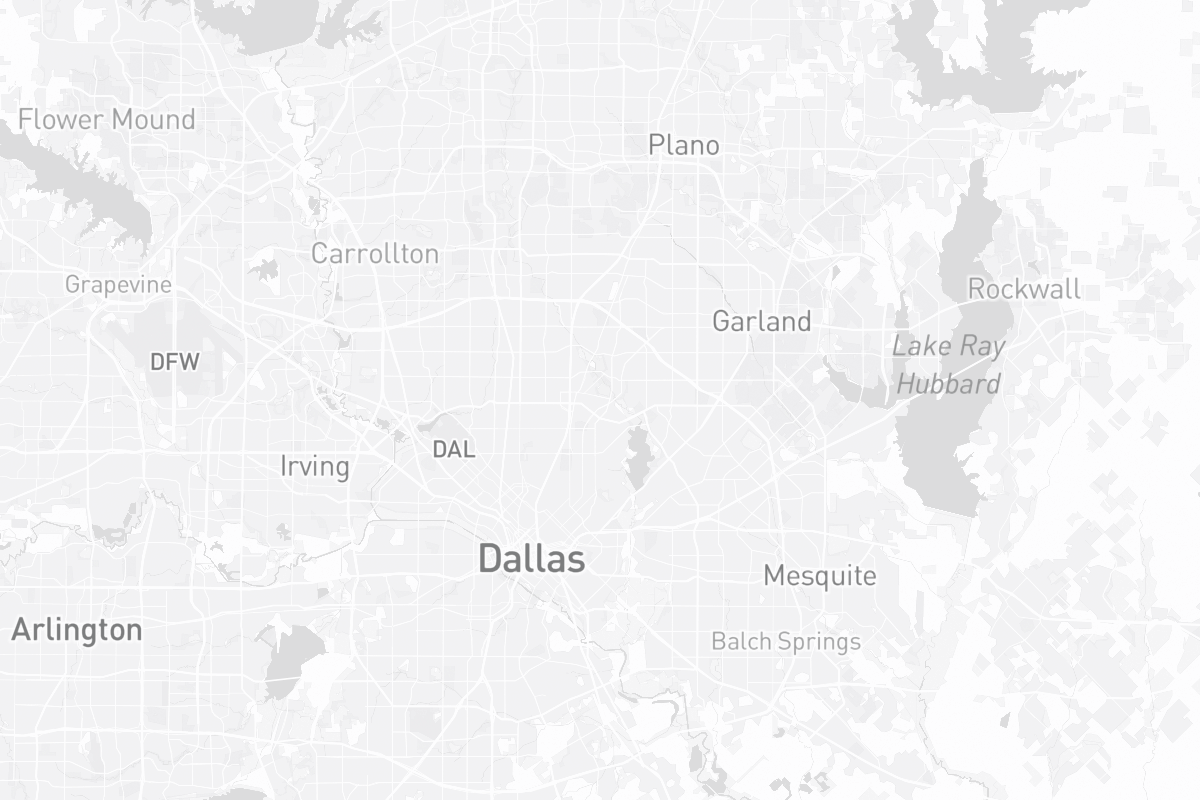
District Map
2024 Election
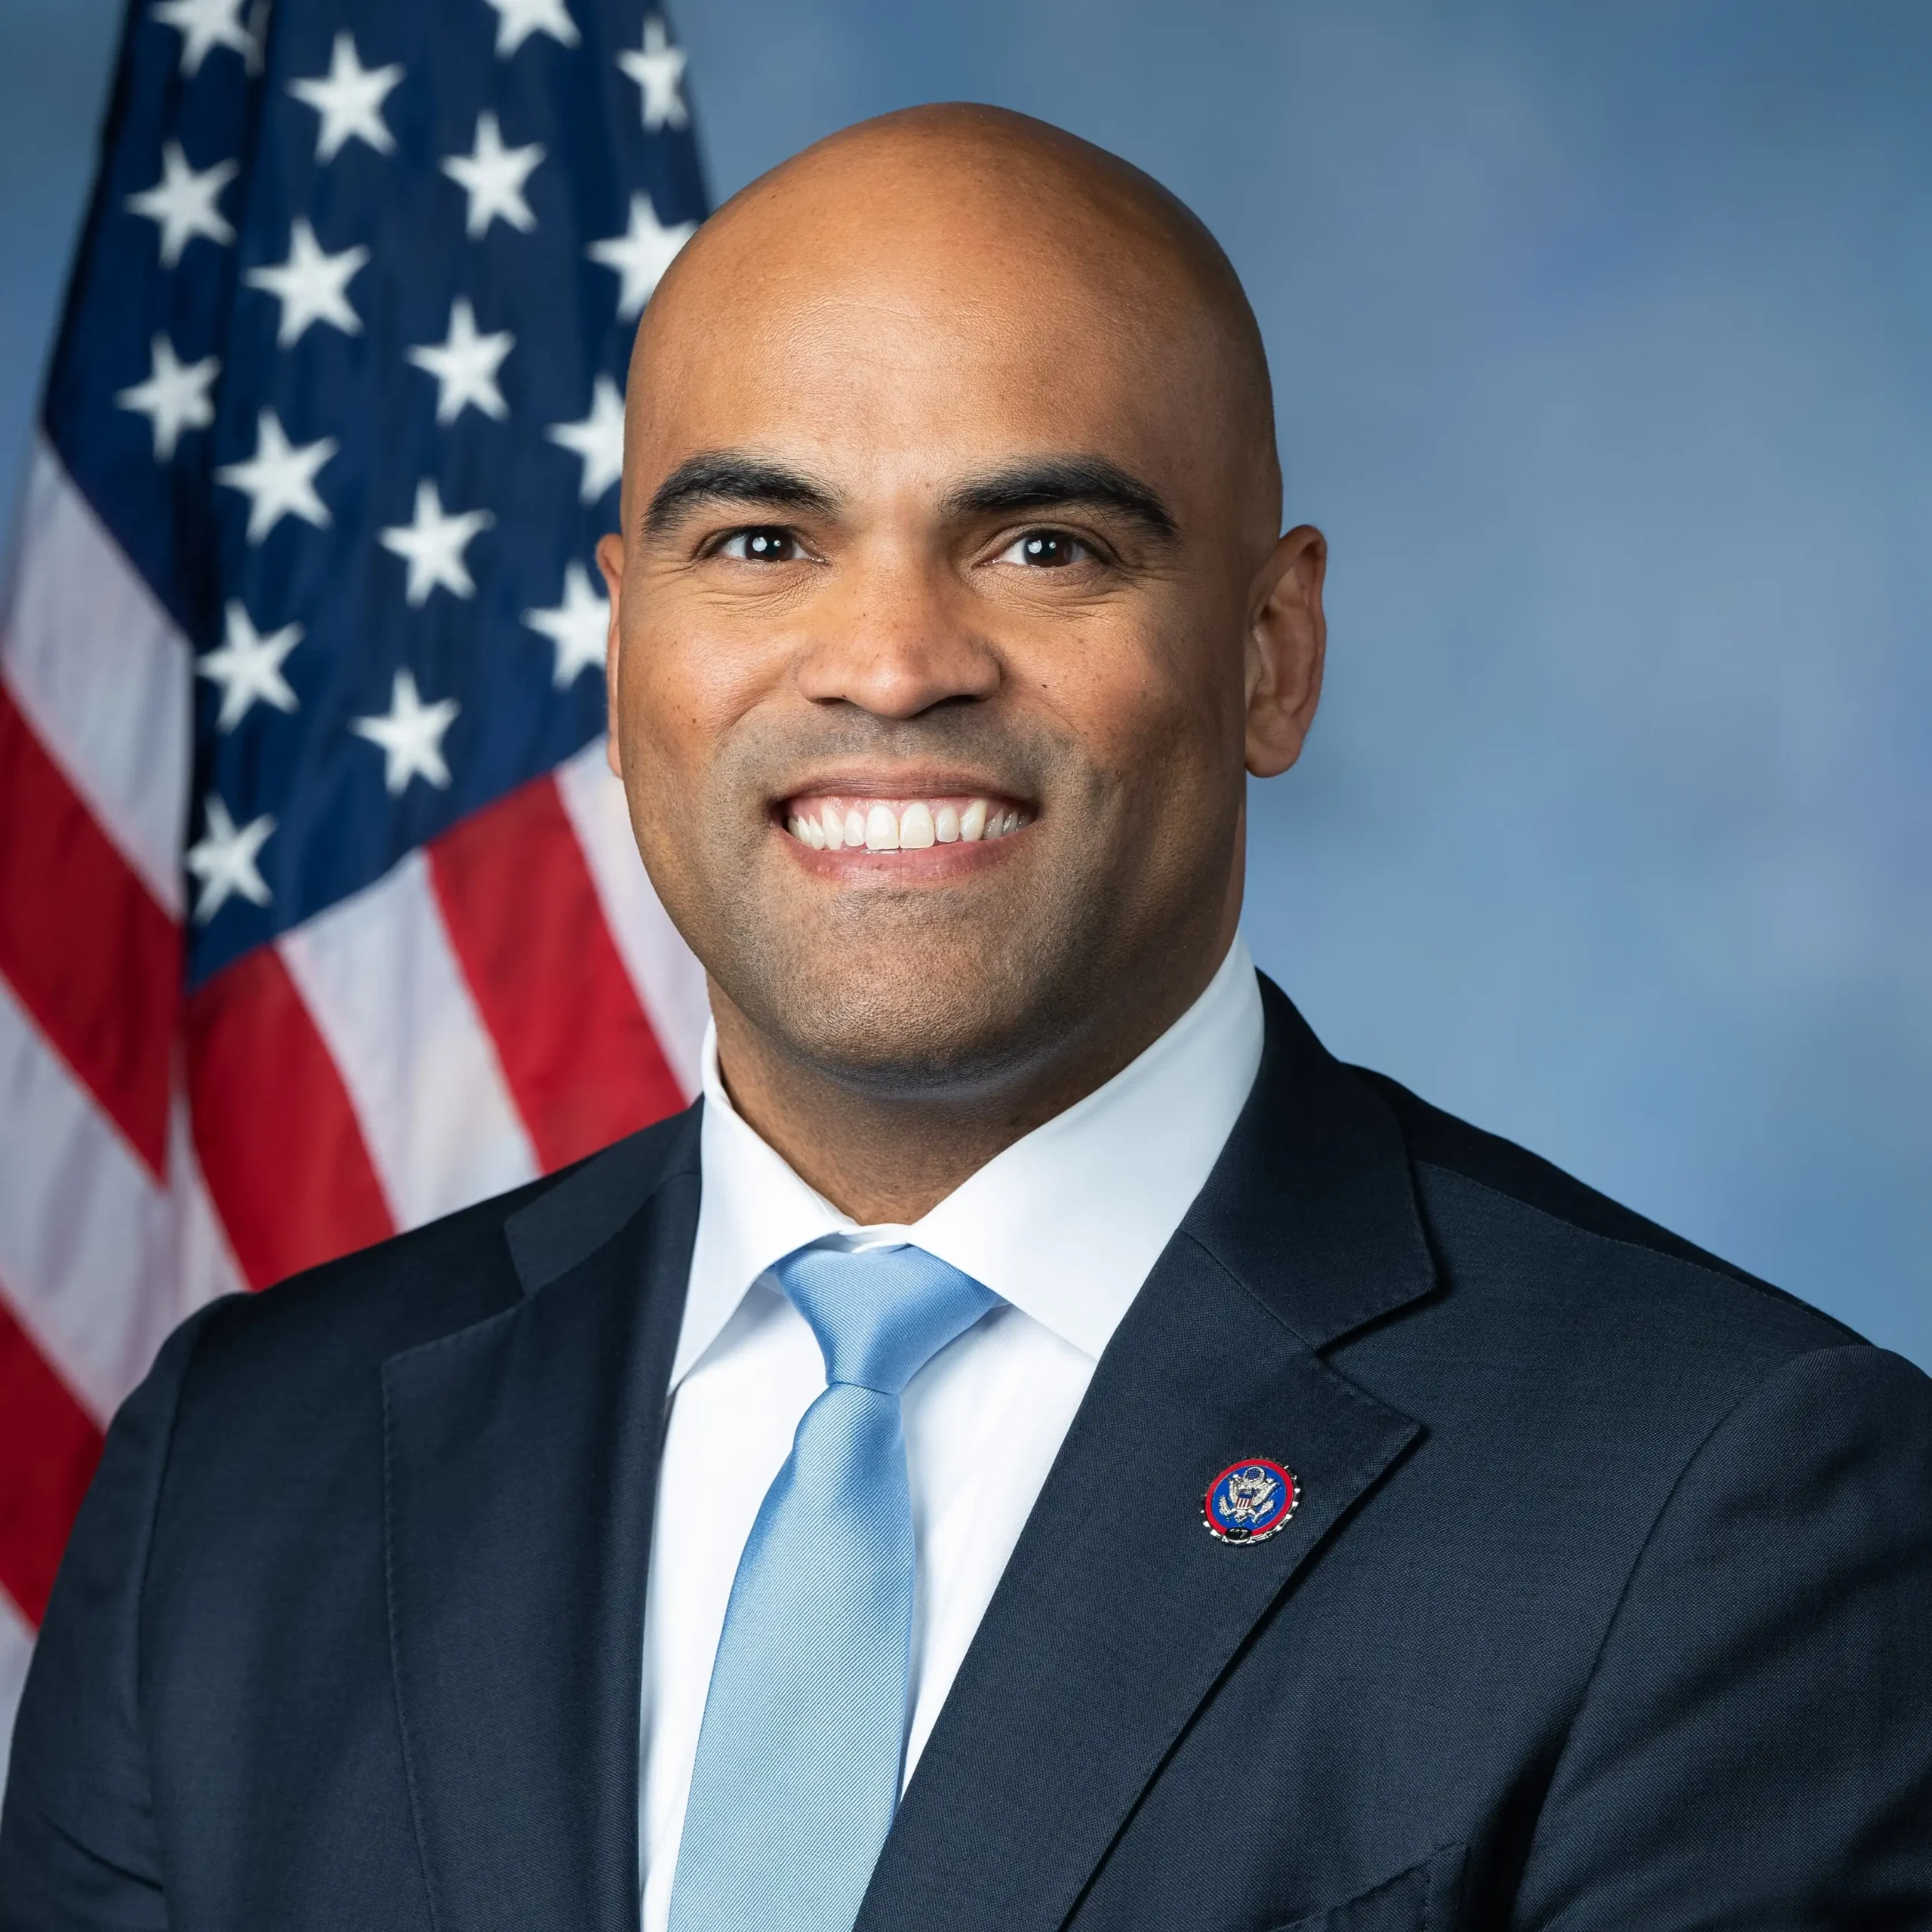
Incumbent
Past Elections
TX-32: 2022, 2020
Candidates


- D
Christopher Panayiotou
✓ 140,536 votes (60.5%) - D
Raja Chaudhry
✓ 140,536 votes (60.5%) - D
Rhetta Bowers
✓ 140,536 votes (60.5%) - D
Callie Butcher
✓ 140,536 votes (60.5%) - D
Brian Dr. Williams
✓ 140,536 votes (60.5%) - D
Justin Moore
✓ 140,536 votes (60.5%) - D
Alex Cornwallis
✓ 140,536 votes (60.5%) - D
Zachariah C. Manning
✓ 140,536 votes (60.5%) - R
Juan Feria
85,941 votes (37%) - R
David Blewett
85,941 votes (37%) - R
Gulrez Khan
85,941 votes (37%) 
Campaign Finance Data
Loading finance data...
Past Elections
Podcasts
ListenNo podcasts found for this election year.