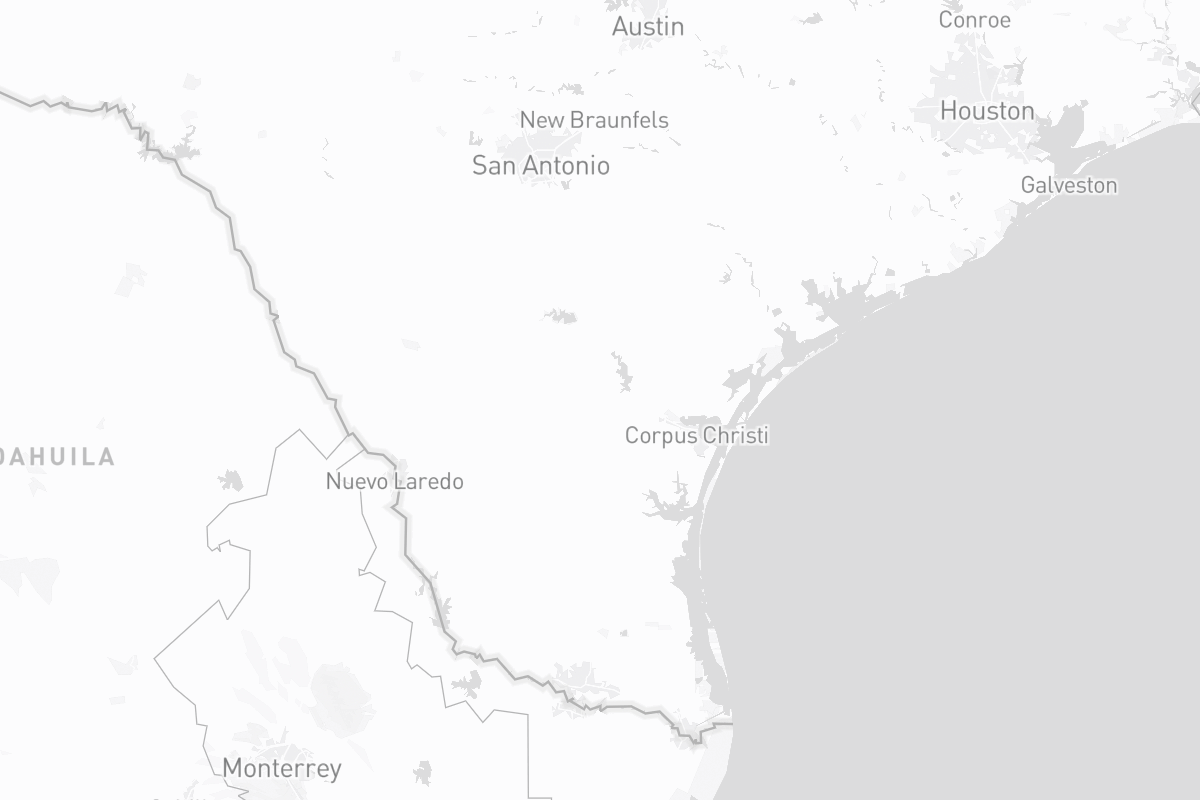
Texas
15th District
District Map
2022 Election
Incumbents
- Open
VACANT
Candidates


RVangela Churchill
✓ 80,978 votes (53.3%)
DRoberto Adrian Haddad
68,097 votes (44.8%)
DIvan Dr. Melendez
68,097 votes (44.8%)
RSara Larue Canady
✓ 80,978 votes (53.3%)
DJohn Villarreal Rigney
68,097 votes (44.8%)
RJose Aizar Cavazos
✓ 80,978 votes (53.3%)
DRuben Ramirez
68,097 votes (44.8%)
DEliza Dr. Alvarado
68,097 votes (44.8%)
RMauro Everett Mr. Garza
✓ 80,978 votes (53.3%)
RRyan P Krause
✓ 80,978 votes (53.3%)
Campaign Finance Data
Loading finance data...
Past Elections
Show AllCollapsePresident
2020
110,283 (48.6%)
✓
114,449 (50.4%)
2,354 (1%)
2016
✓
100,093 (55.6%)
73,204 (40.6%)
6,877 (3.8%)
Senate
2020
101,760 (46.6%)
✓
109,496 (50.2%)
7,024 (3.2%)
2018
✓
89,539 (56.2%)
68,719 (43.2%)
996 (0.6%)
Governor
2018
✓
79,507 (50.2%)
77,165 (48.7%)
1,828 (1.2%)
Chief Justice, Supreme Court
2020
✓
106,869 (49.9%)
101,998 (47.6%)
5,375 (2.5%)
Court of Criminal Appeals Judge, Place 3
2020
✓
108,168 (50.8%)
104,829 (49.2%)
Court of Criminal Appeals Judge, Place 4
2020
✓
106,305 (50%)
106,156 (50%)
Court of Criminal Appeals Judge, Place 9
2020
104,165 (49.3%)
✓
107,305 (50.7%)
Railroad Commissioner
2020
✓
105,773 (49.3%)
102,025 (47.5%)
6,873 (3.2%)
2018
✓
86,184 (55.2%)
66,003 (42.3%)
3,862 (2.5%)
2016
✓
88,459 (51.7%)
66,347 (38.8%)
16,242 (9.5%)
Supreme Court Justice, Place 6
2020
105,705 (49.5%)
✓
107,939 (50.5%)
2018
✓
87,192 (56.1%)
68,321 (43.9%)
Supreme Court Justice, Place 7
2020
✓
104,415 (48.9%)
103,292 (48.4%)
5,620 (2.6%)
Supreme Court Justice, Place 8
2020
✓
106,768 (50.1%)
100,889 (47.4%)
5,354 (2.5%)
Agriculture Commissioner
2018
✓
86,465 (55.4%)
65,890 (42.2%)
3,822 (2.4%)
Attorney General
2018
✓
87,467 (55.8%)
65,917 (42%)
3,481 (2.2%)
Comptroller
2018
✓
82,342 (52.8%)
67,382 (43.2%)
6,249 (4%)
Court of Criminal Appeals Judge, Place 7
2018
✓
87,046 (56%)
68,439 (44%)
Land Commissioner
2018
✓
81,623 (52%)
70,817 (45.1%)
4,541 (2.9%)
Lieutenant Governor
2018
✓
86,104 (54.8%)
67,903 (43.2%)
3,115 (2%)
Presiding Judge, Court of Criminal Appeals
2018
✓
86,771 (55.6%)
66,106 (42.4%)
3,122 (2%)
Supreme Court Justice, Place 2
2018
✓
88,127 (56.6%)
67,571 (43.4%)
Supreme Court Justice, Place 4
2018
✓
86,473 (55.6%)
68,946 (44.4%)
Court of Criminal Appeals Judge, Place 2
2016
✓
92,530 (54.4%)
69,578 (40.9%)
7,959 (4.7%)
Court of Criminal Appeals Judge, Place 5
2016
✓
91,553 (53.7%)
68,799 (40.4%)
10,030 (5.9%)
Court of Criminal Appeals Judge, Place 6
2016
✓
93,940 (55.4%)
69,268 (40.9%)
6,338 (3.7%)
Supreme Court Justice, Place 3
2016
✓
88,138 (51.5%)
68,932 (40.3%)
13,939 (8.2%)
Supreme Court Justice, Place 5
2016
✓
98,656 (57.6%)
66,514 (38.8%)
6,204 (3.6%)
Supreme Court Justice, Place 9
2016
✓
89,267 (52.3%)
74,553 (43.7%)
6,842 (4%)
Podcasts
ListenNo podcasts found for this election year.