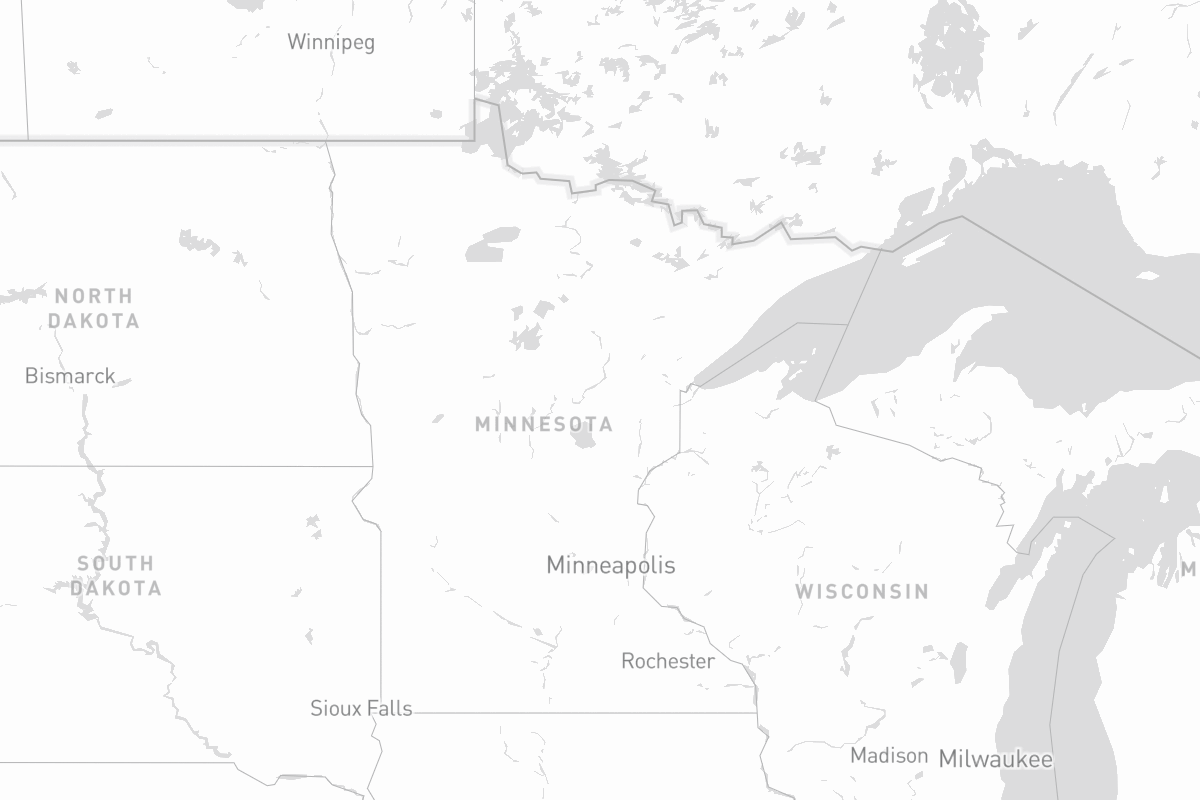
Minnesota
Senate I
State Map
Incumbent
Klobuchar
Past Elections
Show AllCollapsePresident
2012
✓
1,546,167 (52.7%)
1,320,225 (45%)
70,169 (2.4%)
2008
✓
1,573,354 (54.1%)
1,275,409 (43.8%)
61,606 (2.1%)
Senate
2012
✓
1,854,595 (65.2%)
867,974 (30.5%)
120,638 (4.2%)
2008
✓
1,212,629 (42%)
1,212,317 (42%)
462,700 (16%)
Governor
2010
✓
919,232 (43.6%)
910,462 (43.2%)
277,327 (13.2%)
U.S. House Composite
2012
✓
1,560,984 (55.5%)
1,210,409 (43%)
41,990 (1.5%)
2010
✓
1,002,026 (47.9%)
970,741 (46.4%)
117,824 (5.6%)
2008
✓
1,612,480 (57.5%)
1,069,015 (38.1%)
121,119 (4.3%)
Attorney General
2010
✓
1,075,536 (52.9%)
839,033 (41.3%)
118,518 (5.8%)
Auditor
2010
✓
981,822 (48.4%)
956,339 (47.1%)
90,926 (4.5%)
Secretary of State
2010
✓
999,382 (49.1%)
928,913 (45.6%)
107,070 (5.3%)
Podcasts
ListenNo podcasts found for this election year.