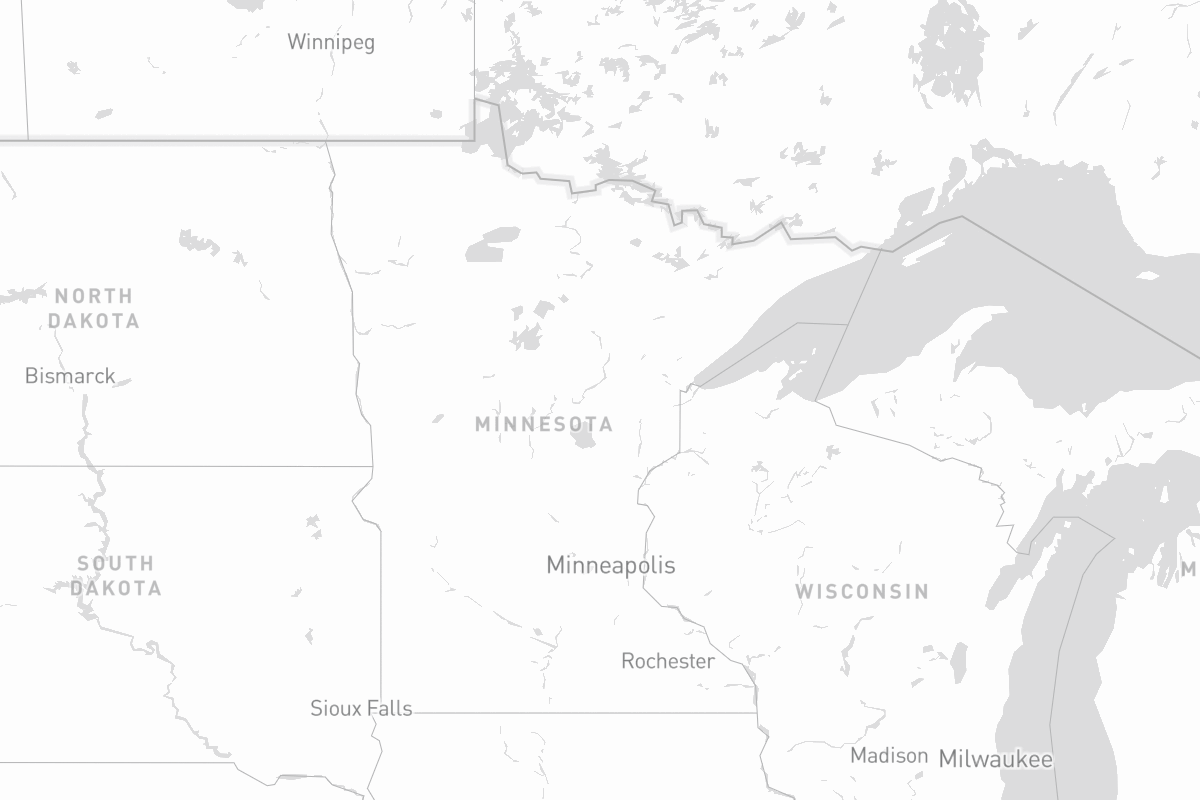
You are viewing a past election.

Minnesota
President

State Map

State map

Final Rating

See All
Lean D

Baseline

What's This?
N/A

2012 Election

No persons found for this state, office, and election year.

Past Elections

Show AllCollapse

President

2008
54.1%
43.8%
D
Democrat
1,573,354 (54.1%)
R
Republican
1,275,409 (43.8%)
Other
61,606 (2.1%)

Senate

2008
42%
42%
D
Democrat
1,212,629 (42%)
R
Republican
1,212,317 (42%)
Other
462,700 (16%)

Governor

2010
43.6%
43.2%
D
Democrat
919,232 (43.6%)
R
Republican
910,462 (43.2%)
Other
277,327 (13.2%)

Attorney General

2010
D
Democrat
1,075,536 (52.9%)
R
Republican
839,033 (41.3%)
Other
118,518 (5.8%)

Auditor

2010
D
Democrat
981,822 (48.4%)
R
Republican
956,339 (47.1%)
Other
90,926 (4.5%)

Secretary of State

2010
D
Democrat
999,382 (49.1%)
R
Republican
928,913 (45.6%)
Other
107,070 (5.3%)

U.S. House Composite

2010
D
Democrat
1,002,026 (47.9%)
R
Republican
970,741 (46.4%)
Other
117,824 (5.6%)
2008
D
Democrat
1,612,480 (57.5%)
R
Republican
1,069,015 (38.1%)
Other
121,119 (4.3%)

Podcasts

Listen
No podcasts found for this election year.

Share

Twitter (X) Facebook Email

Ratings

2012
Lean Democrat
Solid Democrat
Solid Democrat
Lean Democrat
Solid Democrat
Solid Democrat
Solid Democrat
Lean Democrat
Solid Democrat
Solid Democrat
Lean Democrat
Solid Democrat
Lean Democrat

Baselines

About
2024
+6.9
2022
+6.4
2020
+7.4
2018
+9.2
2016
+6.7
2014
+8.0
You are viewing a past election. Go to 2026