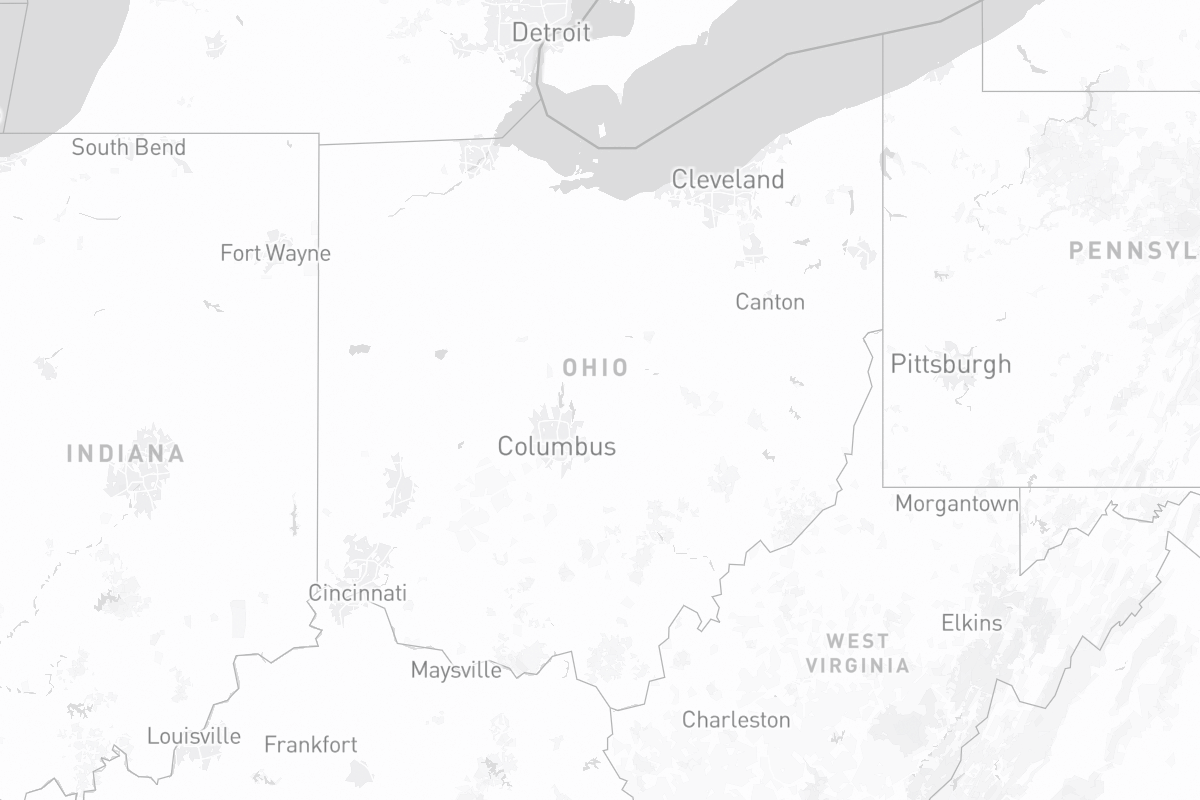
You are viewing a past election.

Ohio
Governor

State Map

State map

Final Rating

See All
Tilt R

Baseline

What's This?
N/A

2010 Election

No persons found for this state, office, and election year.

Past Elections

Show AllCollapse

President

2008
51.5%
46.9%
D
Democrat
2,940,044 (51.5%)
R
Republican
2,677,820 (46.9%)
Other
90,486 (1.6%)

Attorney General

2008
D
Democrat
2,890,953 (56.8%)
R
Republican
1,956,252 (38.4%)
Other
246,002 (4.8%)

U.S. House Composite

2008
D
Democrat
2,752,111 (51.2%)
R
Republican
2,491,498 (46.4%)
Other
130,731 (2.4%)

Podcasts

Listen
No podcasts found for this election year.

Share

Twitter (X) Facebook Email

Ratings

2010
Tilt Republican
Toss-up

Baselines

About
2024
+10.0
2022
+11.0
2020
+11.5
2018
+9.5
2016
+12.3
2014
+8.3
You are viewing a past election. Go to 2026