Oklahoma
1st District
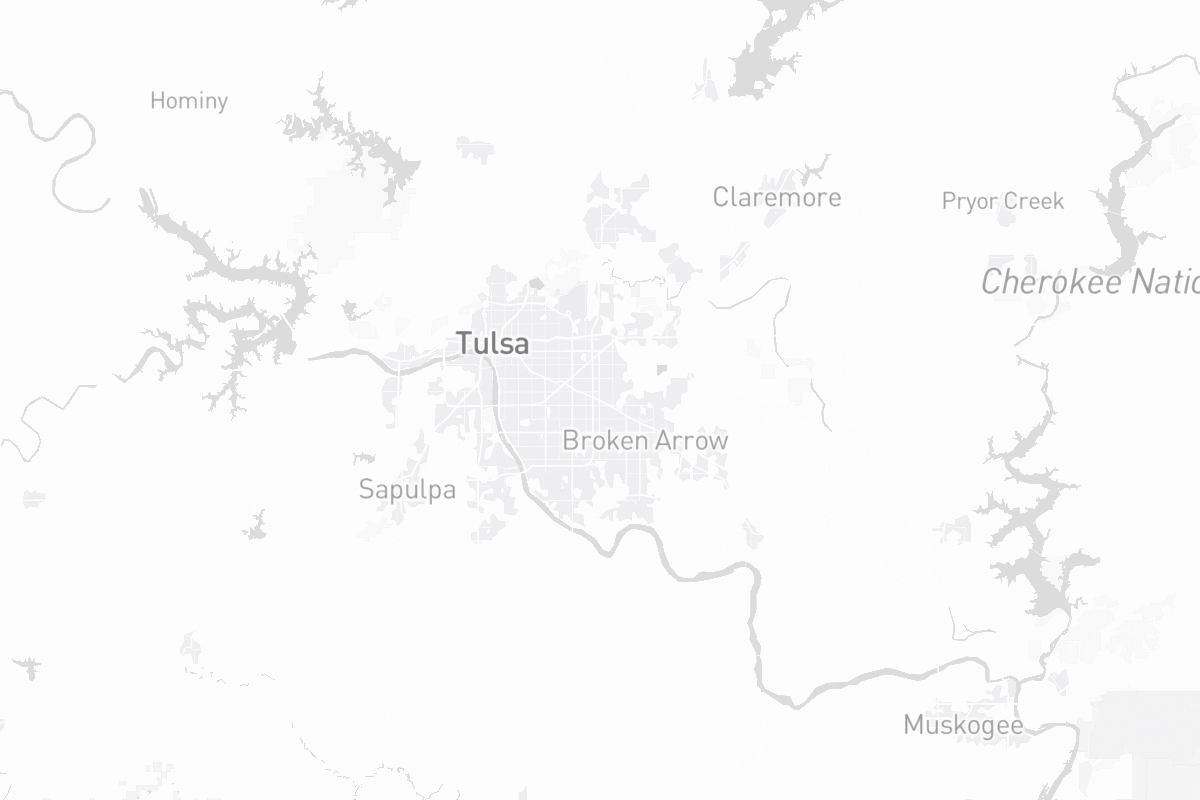
Tulsa area
District Map
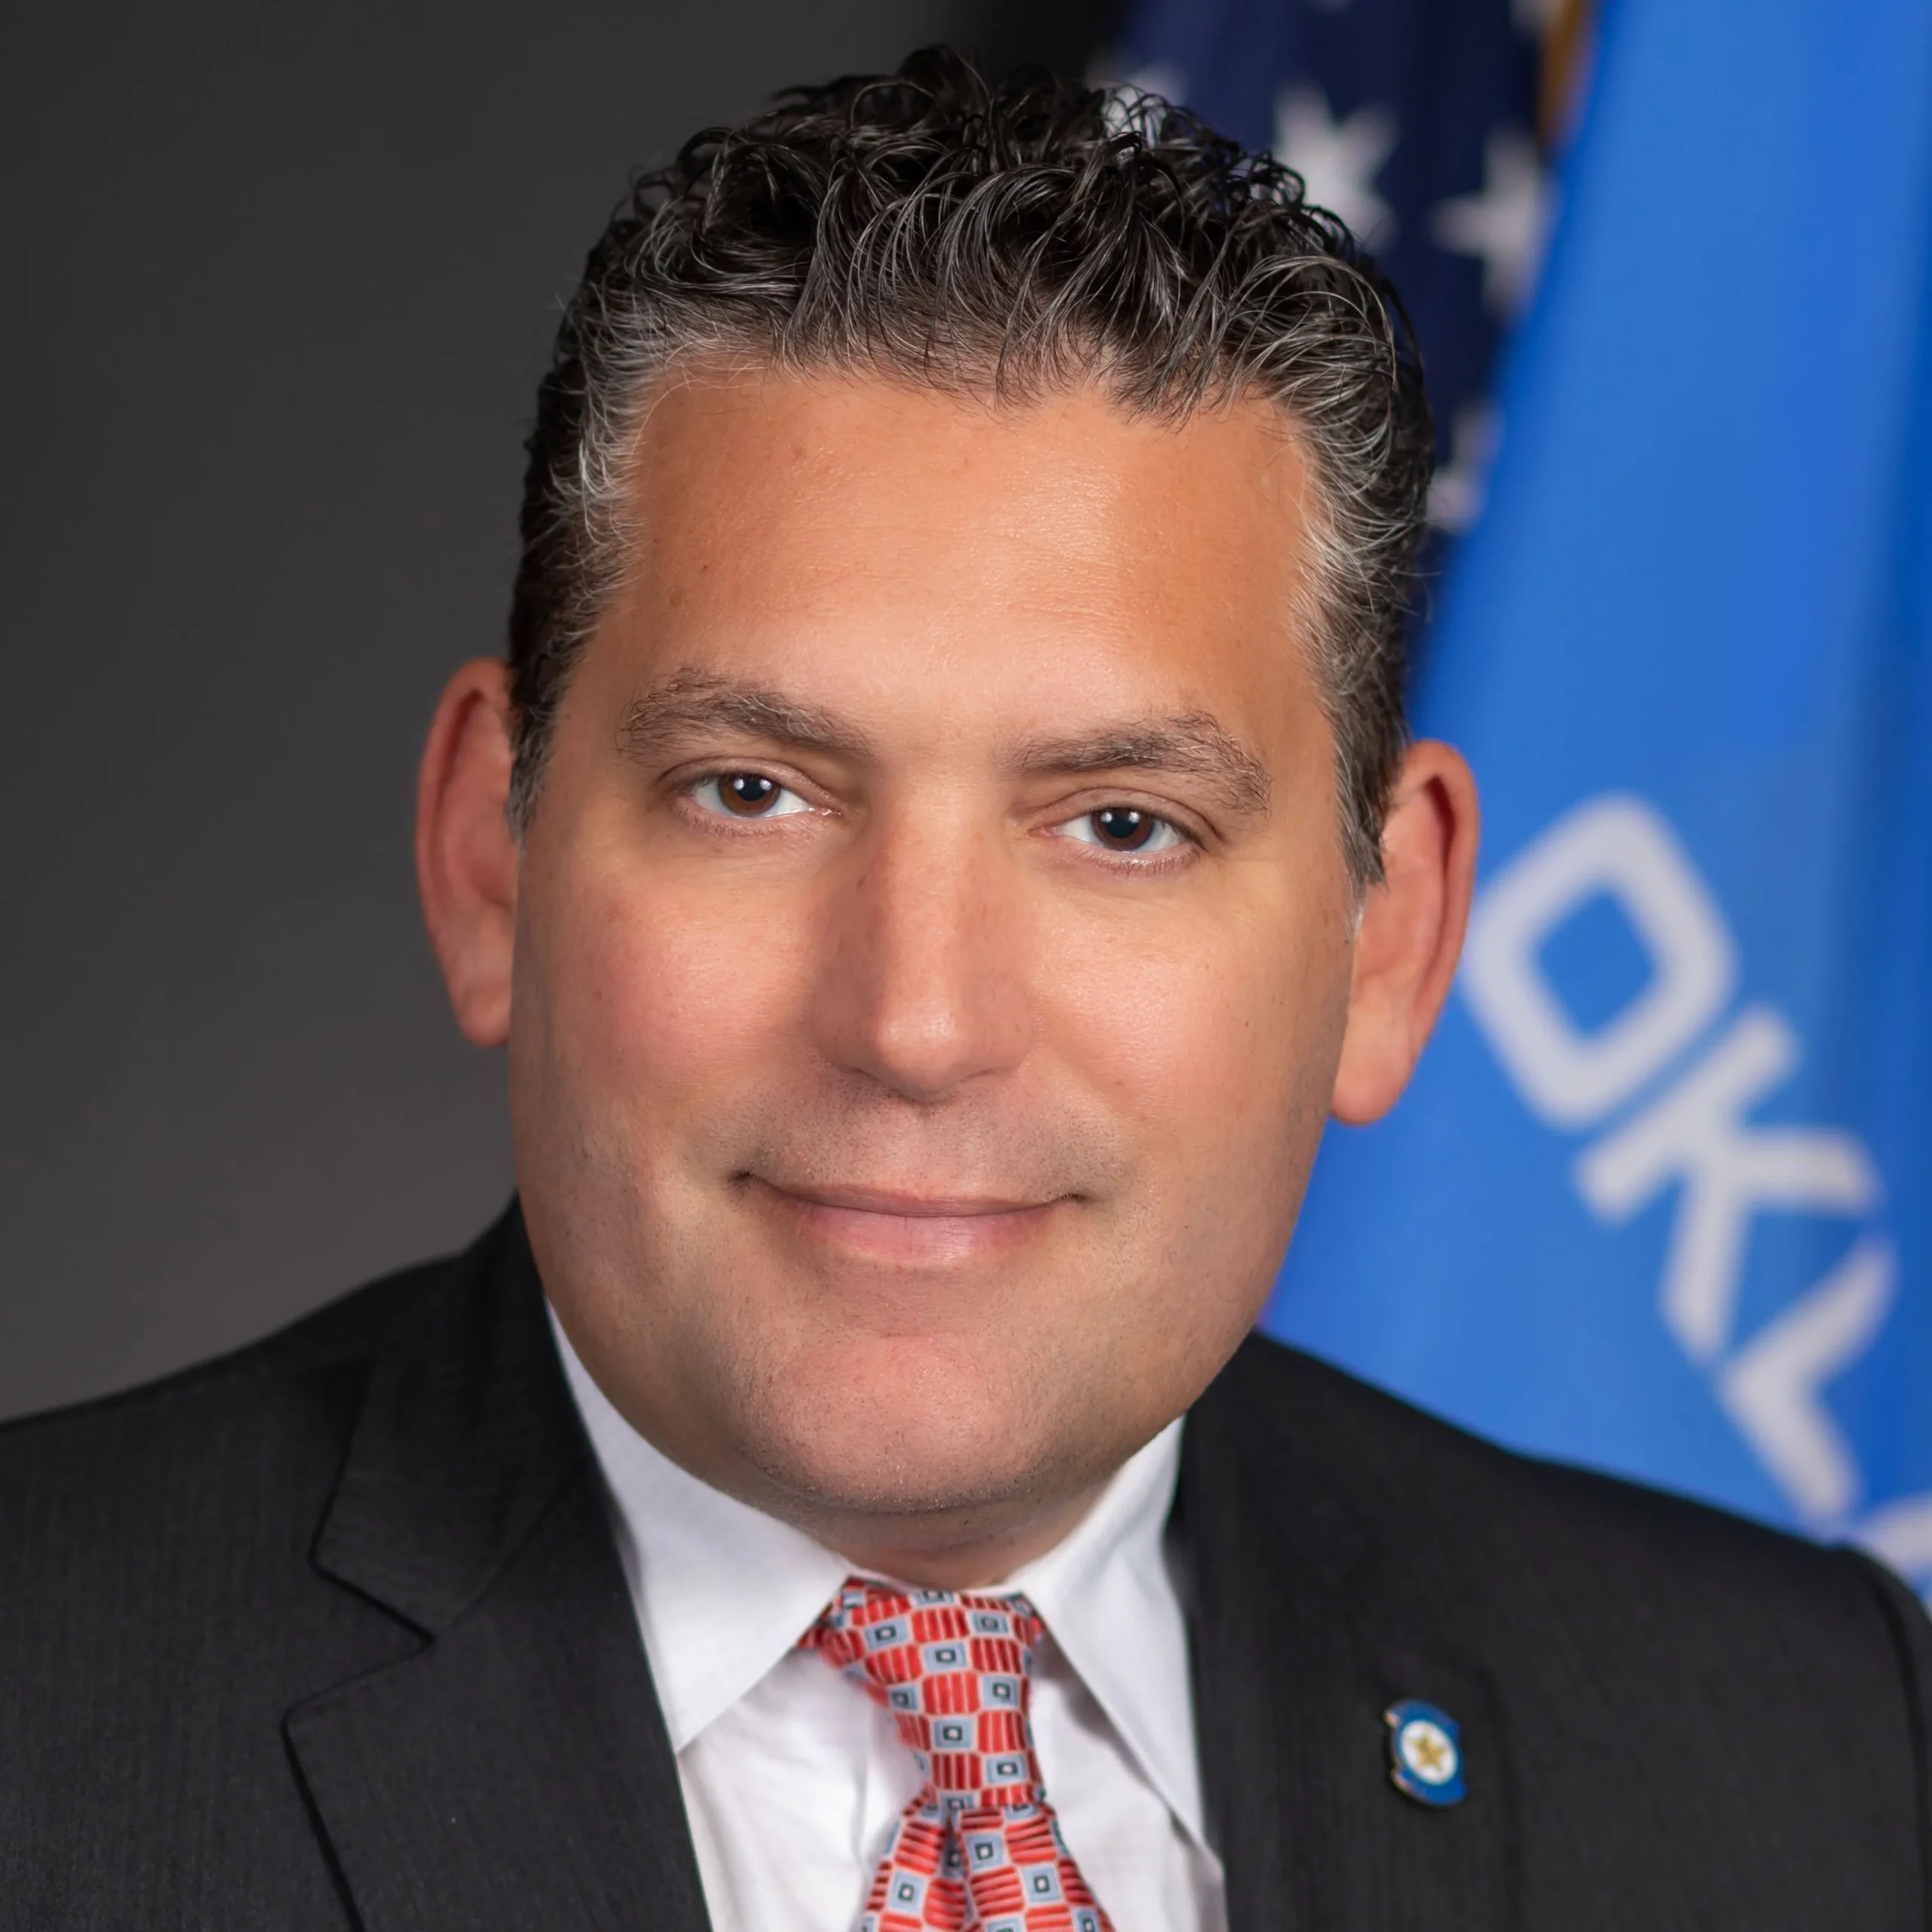
2026 Election
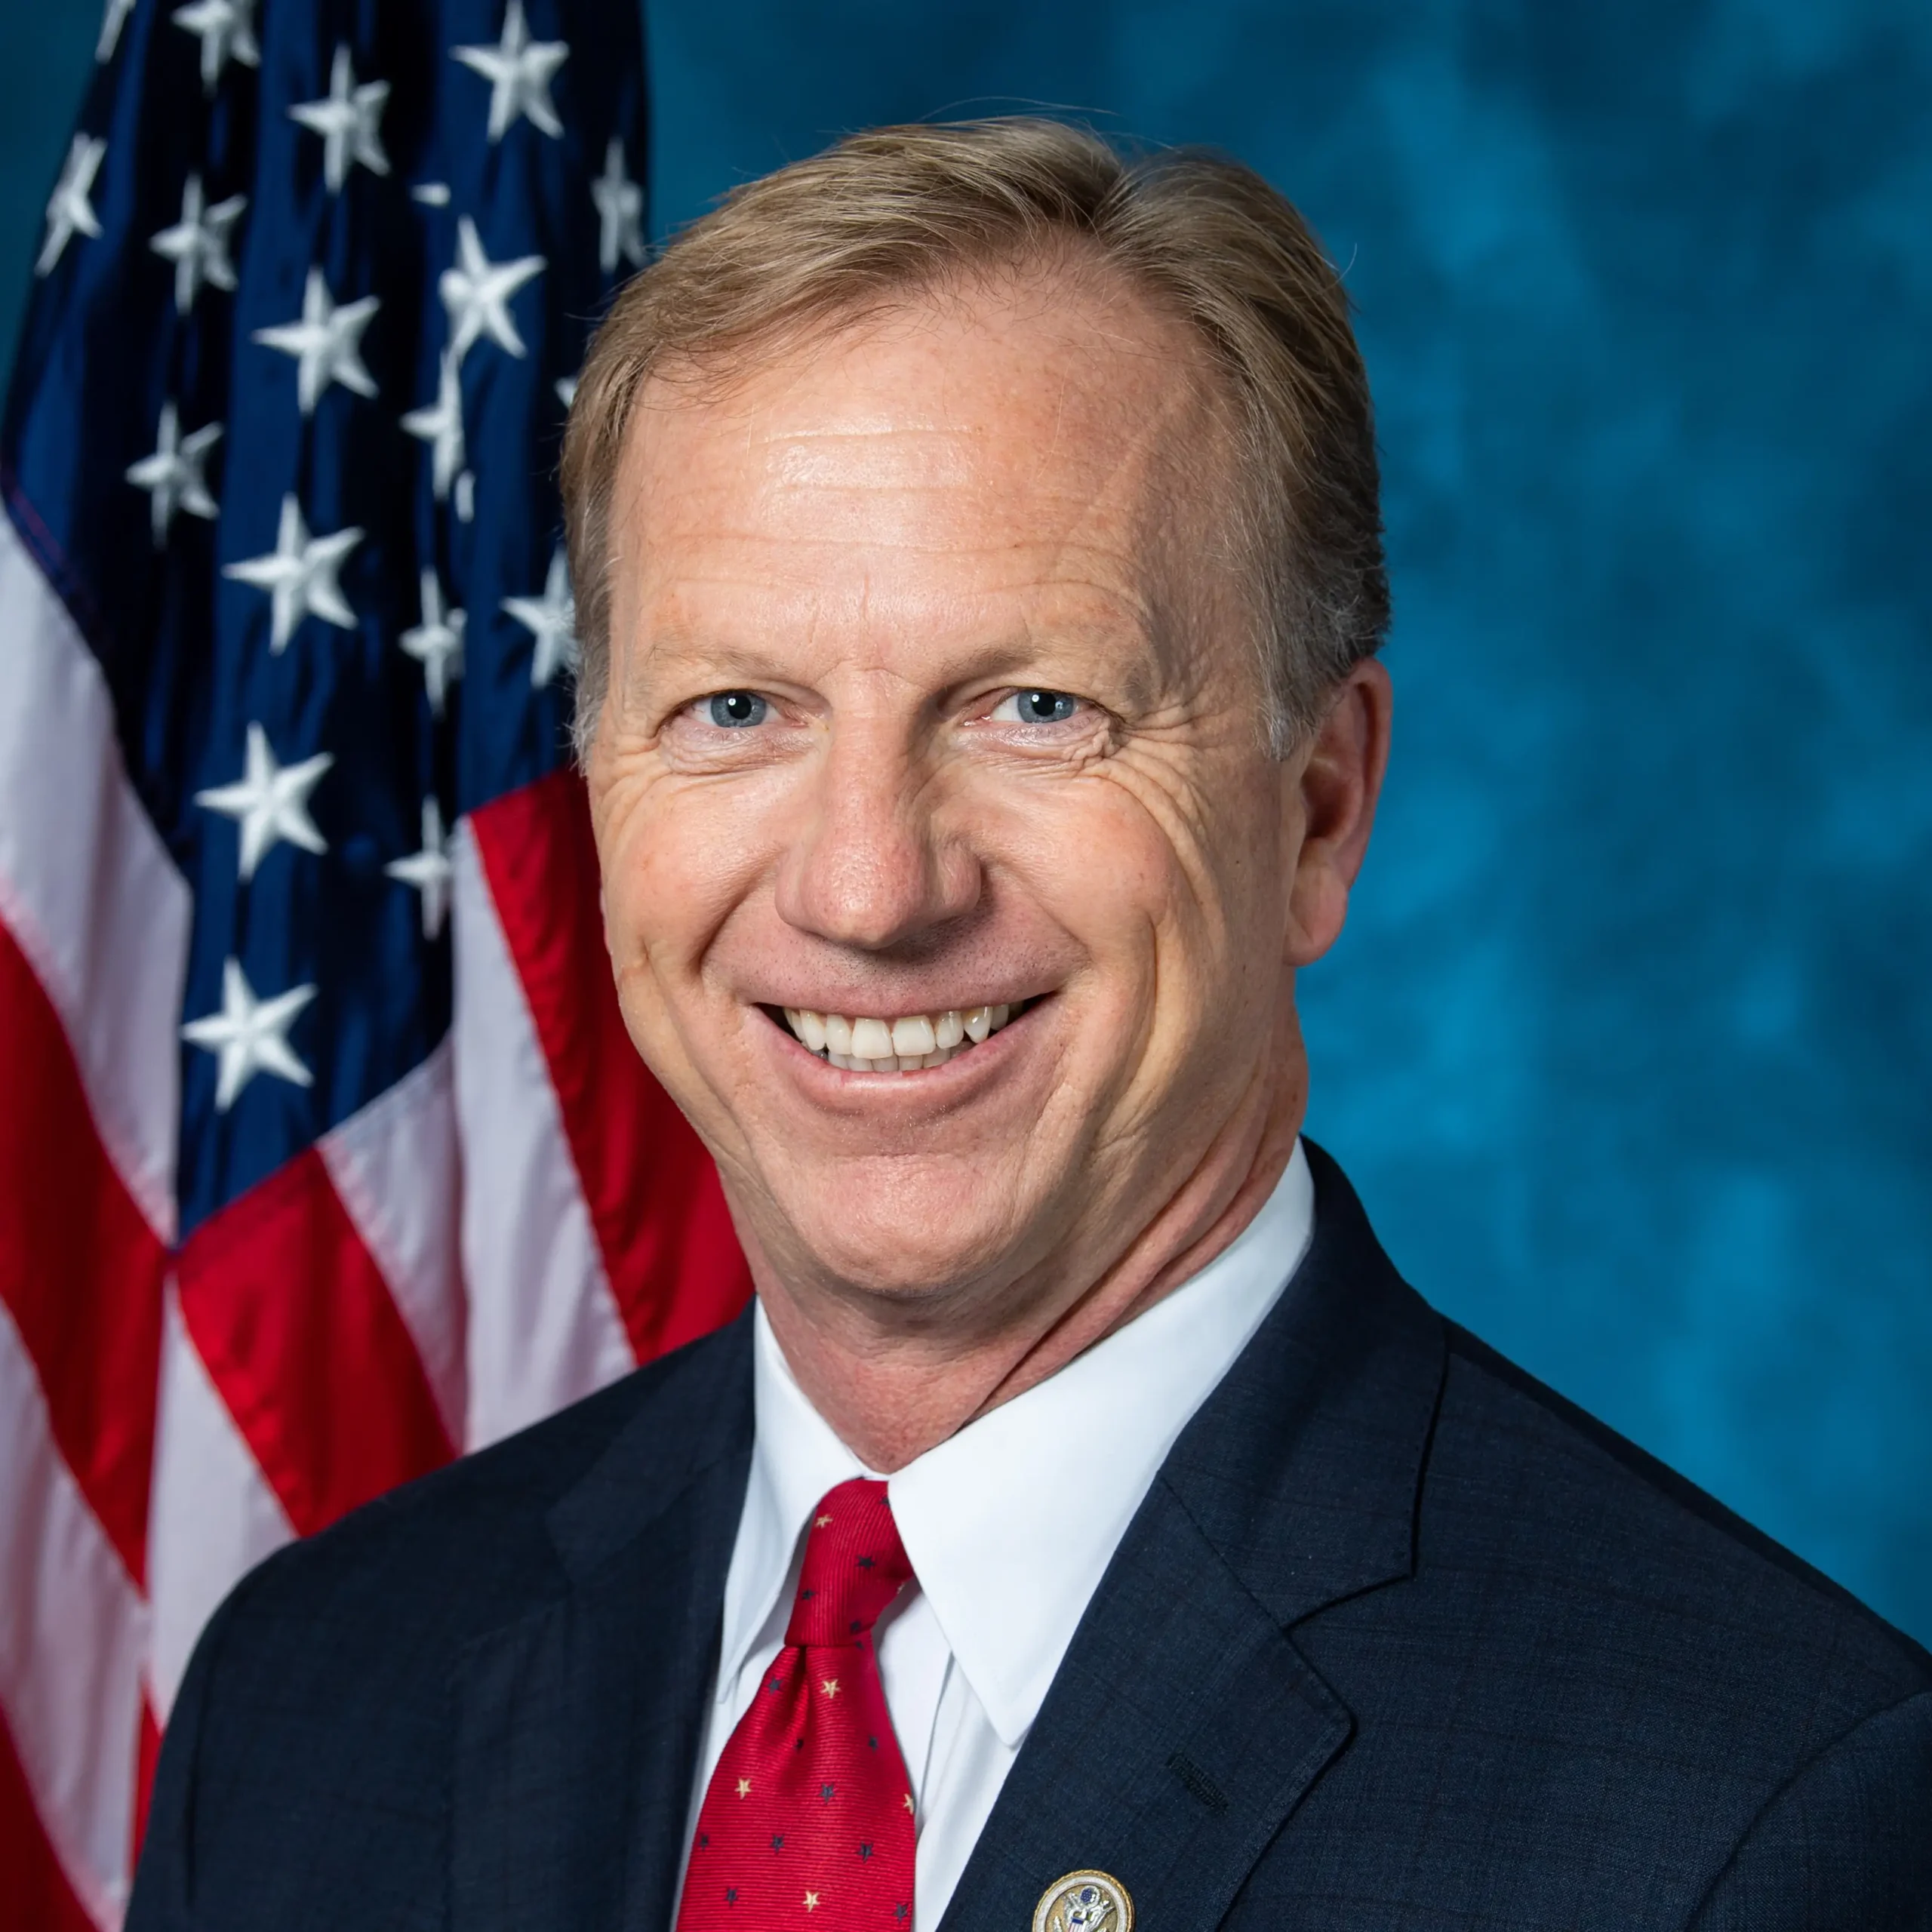
Incumbent


Campaign Finance Data
Loading finance data...
Past Elections
Podcasts
Listen
Podcast Episode 74: Inside Capitol Hill and Midterm Elections w/ Manu Raju of CNN

Podcast Episode 73: Maryland (Primary) Matters w/ Pamela Wood of The Banner

Podcast Episode 72: New York! New York! Primaries w/ Jeff Coltin of City & State

Podcast Episode 71: Which Nebraska Republicans Might Lose? w/ Aaron Sanderford of Nebraska Examiner

Podcast Episode 70: O-H I-O Primaries w/ Henry J. Gomez of NBC News

Podcast Episode 69: Redistricting War Hits Virginia w/ Randi B. Hagi of WMRA

Podcast Episode 68: Best Campaign Ad Draft w/ Erin Covey and Kirk Bado