New York
7th District
Northern Brooklyn and western Queens
District Map
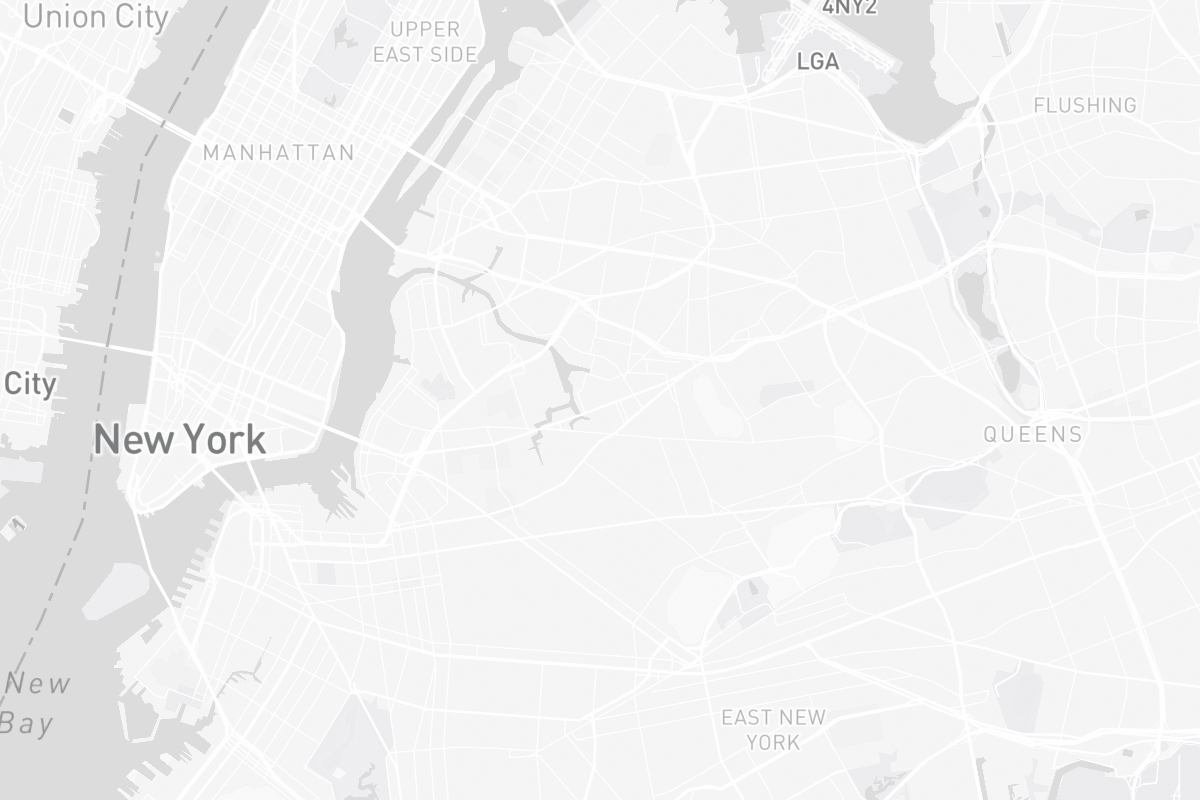
Current (2024)
Previous (2022)
Northern Brooklyn and western Queens