Illinois
9th District
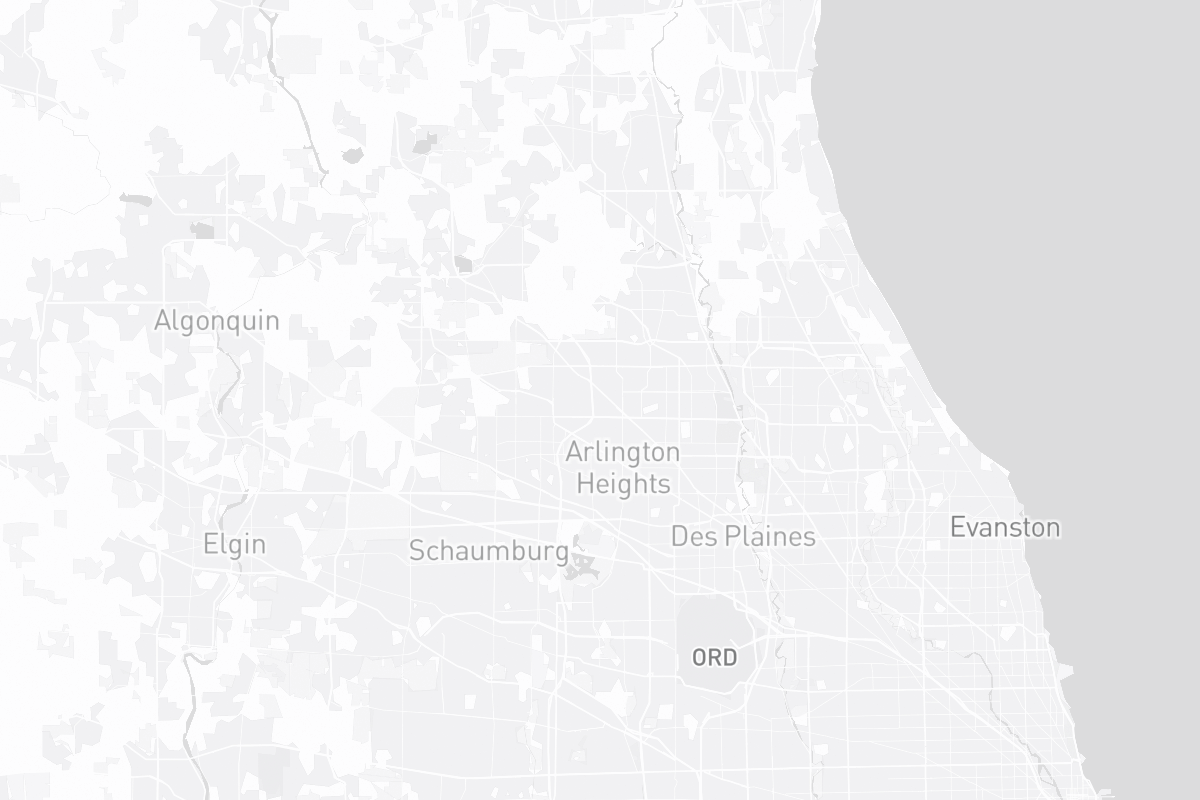
Parts of northern Chicago, inner and outer northwestern suburbs, and the North Shore
District Map
2026 Election
Incumbent

Past Elections


Campaign Finance Data
Loading finance data...
Past Elections
Podcasts
Listen
Podcast Episode 74: Inside Capitol Hill and Midterm Elections w/ Manu Raju of CNN

Podcast Episode 73: Maryland (Primary) Matters w/ Pamela Wood of The Banner

Podcast Episode 72: New York! New York! Primaries w/ Jeff Coltin of City & State

Podcast Episode 71: Which Nebraska Republicans Might Lose? w/ Aaron Sanderford of Nebraska Examiner

Podcast Episode 70: O-H I-O Primaries w/ Henry J. Gomez of NBC News

Podcast Episode 69: Redistricting War Hits Virginia w/ Randi B. Hagi of WMRA

Podcast Episode 68: Best Campaign Ad Draft w/ Erin Covey and Kirk Bado