California
8th District
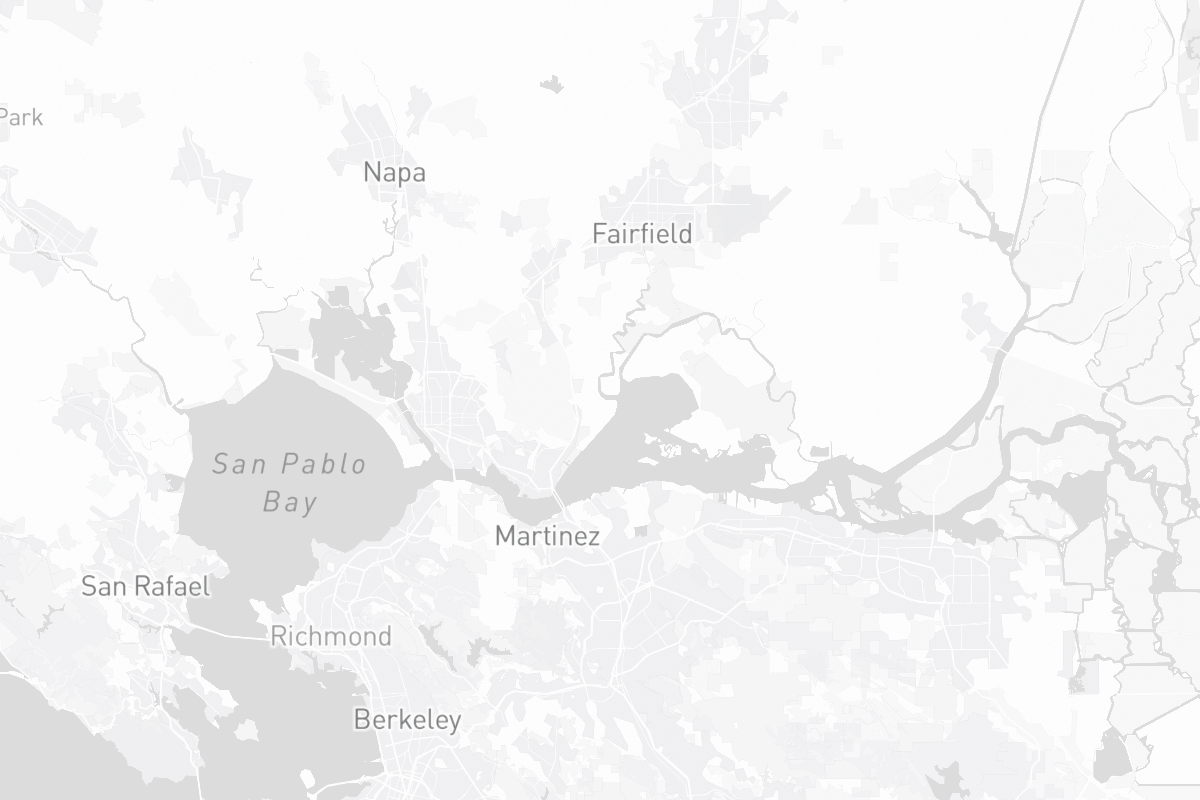
District Map
2024 Election
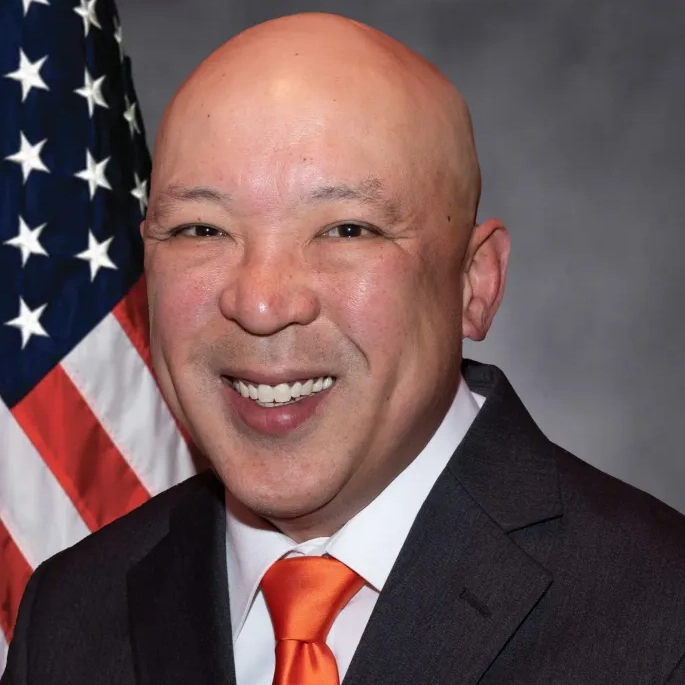
Incumbent
Candidate
Campaign Finance Data
Loading finance data...
Past Elections
Podcasts
ListenNo podcasts found for this election year.

Loading finance data...