You are viewing a past election.
New York
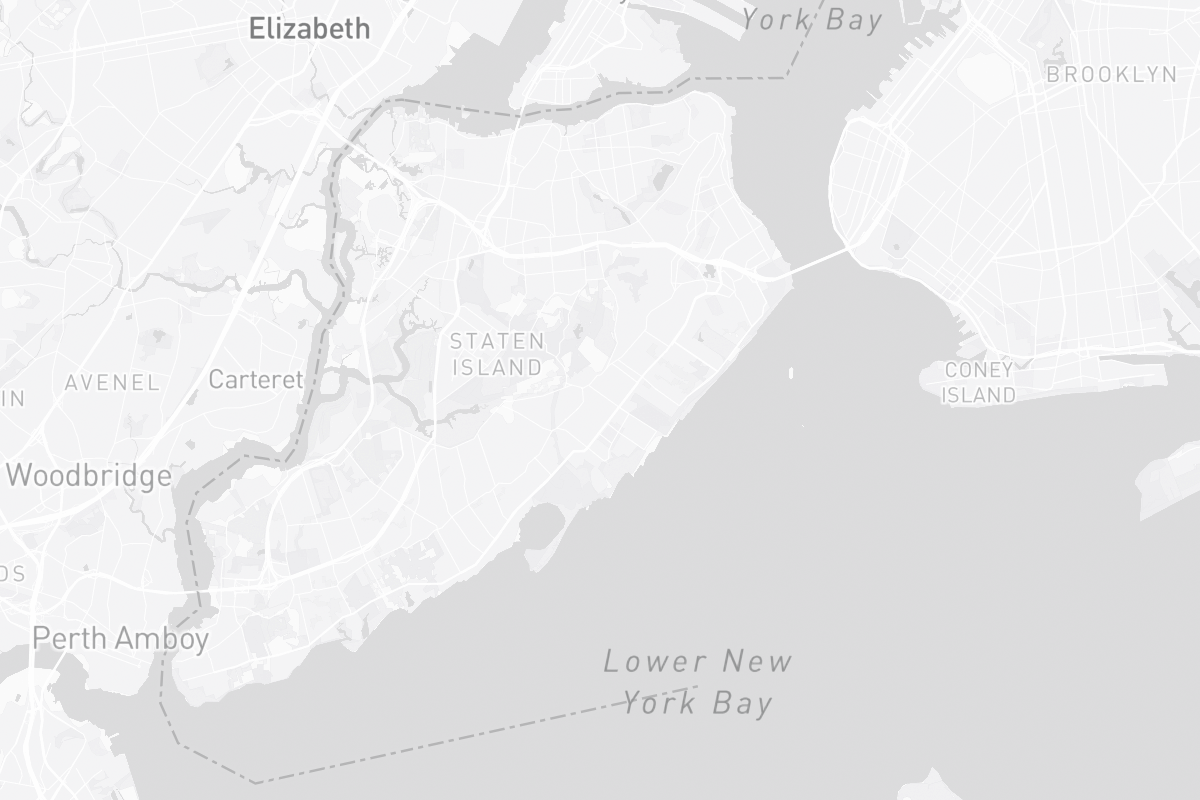
11th District
District Map
Current (2022)
Previous
2022 Election
Incumbent
Past Elections
NY-11: 2020
Incumbent
Past Elections
NY-11: 2020
Campaign Finance Data
| CANDIDATE |
RAISED |
SPENT |
CASH-ON-HAND |
Subscribe
To view past election results you'll need to have access to an active subscription.
No podcasts found for this election year.
Ratings
May 25, 2022
Likely Republican
May 20, 2022
Lean Republican
September 18, 2020
Toss-up
October 26, 2018
Lean Republican
December 1, 2017
Likely Republican
September 1, 2017
Likely Republican
February 27, 2017
Solid Republican
December 4, 2015
Solid Republican
May 15, 2015
Solid Republican
April 3, 2015
Solid Republican
October 29, 2014
Tilt Republican
September 24, 2014
Tilt Democrat
April 28, 2014
Lean Democrat
December 17, 2013
Lean Republican
March 8, 2013
Lean Republican
October 26, 2012
Lean Republican
March 23, 2012
Tilt Republican