California
17th District
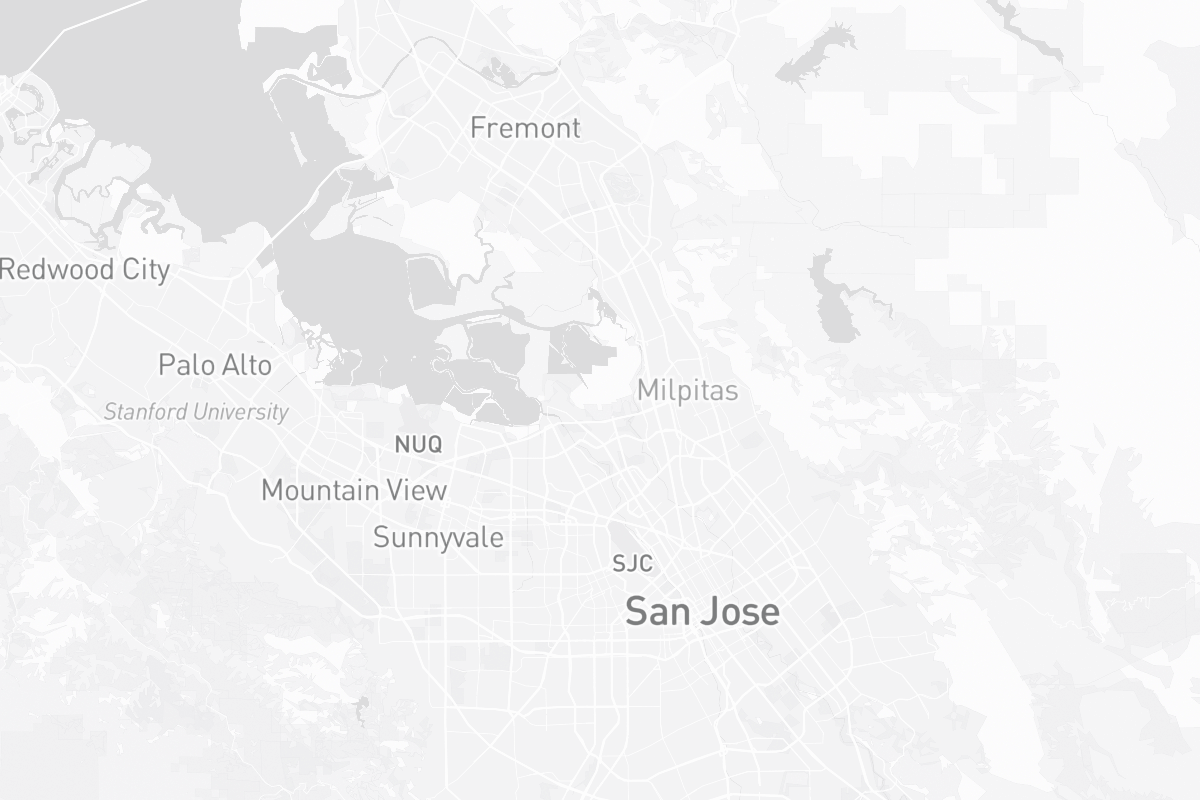
District Map
2022 Election
Incumbent

Past Elections
CA-17: 2020, 2018, 2016
Candidate

Campaign Finance Data
Loading finance data...
Past Elections
Podcasts
ListenNo podcasts found for this election year.